Lind Capital Partners Municipal Market Commentary

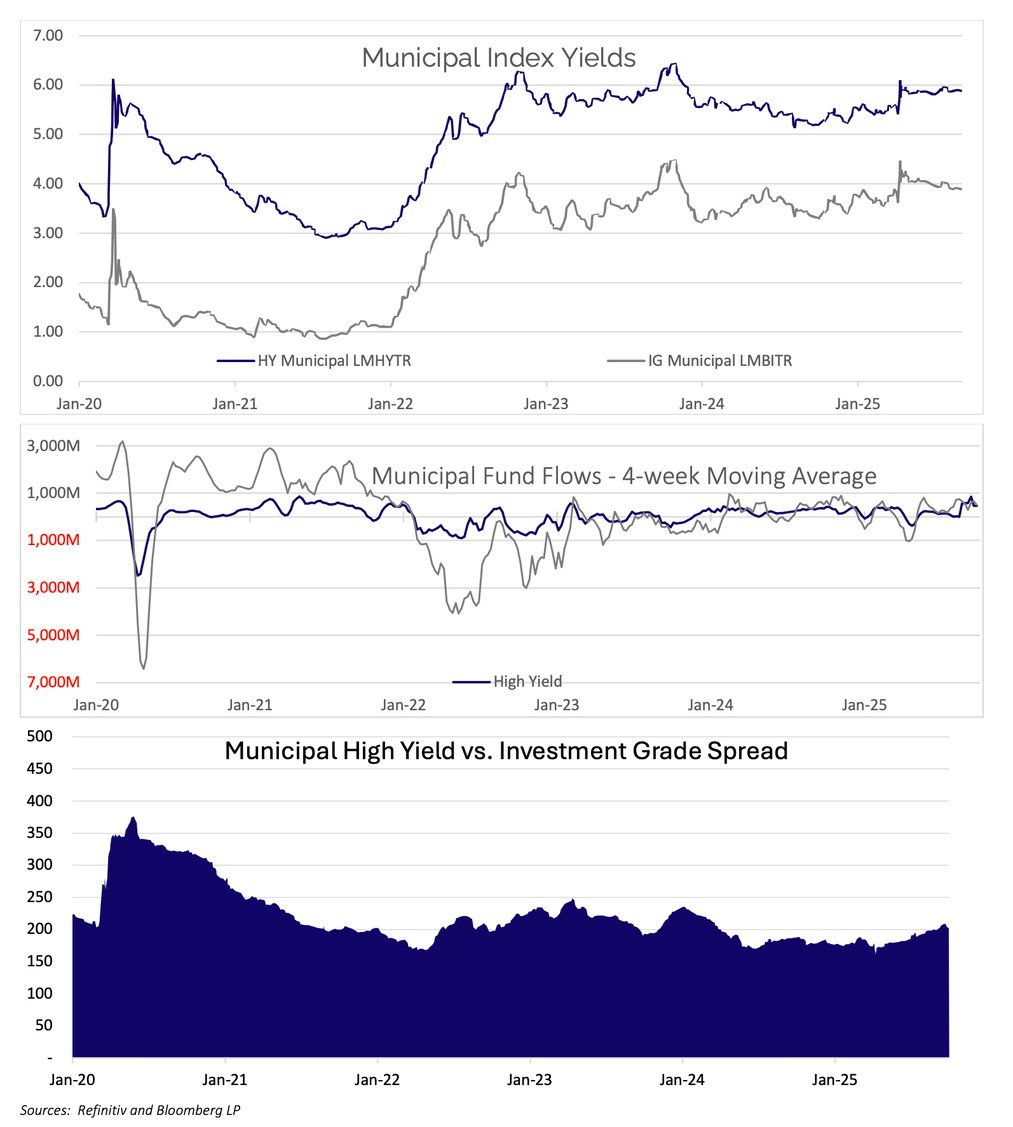
Municipal Market Performance and Benchmark Rates: After dovish comments by Federal Reserve Chairman Jerome Powell last month in Jackson Hole, the anticipation and ultimate fulfillment of a rate cut propelled the municipal market to it’s strongest September performance in over a decade. The AAA Municipal Benchmark bull-flattened this month as 5-year yields fell by 7 bps while yields in 10 and 30-years fell by 28 bps and 34 bps, respectively. The US Treasury market underperformed municipals, as rates were unchanged in 5-years and lower by 11bps in 10-years and 23 bps out in 30-years.
Buoyed by treasury market stability and favorable technicals, investment grade municipal bonds (LMBITR) posted second consecutive month of positive performance and best September returns since 2009, ultimately gaining 2.26% this month (2.58% YTD). The Bloomberg Municipal High Yield Total Return Index (LMHYTR) outperformed, returning 2.61% in September, but still lags investment grade YTD, gaining 1.27% in 2025.
Mutual Fund Flows: Despite closing the month with modest outflows, after five straight weeks of inflows, demand for municipal funds (open-end & ETFs) remained robust in September, with total inflows approaching $4B. Inflows were largely split between investment grade and high yield, which is notable for high yield, as it represents only a fraction of the overall municipal market. We believe it is indicative of the attractive nature of yields in high yield funds, both from a relative and absolute perspective. Also noteworthy is the flow of funds into high yield municipal ETFs. We consider ETF flows to be more of a “tactical” allocation rather than long term investments. We view it notable given the lack of credit work and surveillance performed by these ETFs
Primary Market Supply: The municipal market experienced relatively light primary supply in September for what felt like the first time year-to-date. Total supply approached $44B, which is down 6% YoY and 8% versus the trailing 5-year average for the month of September. Manageable supply, coupled with robust demand and a supportive Fed backdrop, certainly drove the positive municipal performance this month. Year-to-date supply still remains elevated, ~15% higher, versus last year. Looking ahead, the breather may be short-lived, as strategists from Bank of America are forecasting municipal issuance of $58B in October (20% higher versus trailing 10-year average), which is historically one heaviest issuance months of the year. Elevated supply typically results in new issue volatility and excellent investment opportunities.
Lind Capital Partners Municipal Non-Rated Market Commentary
In our October 2023 Note, Cost of Complacency, we highlighted a developing trend in investor behavior: Complacency. Given how high rates had risen due to Federal Reserve policy, investors had grown increasing comfortable with the attractive yields offered by short-term cash alternatives, such as U.S. Treasury Bills and money market funds. We highlighted the opportunity cost of “hiding out” in these short-term taxable instruments. The analysis concluded that in stable or declining rate environments, investors who stayed in
cash incurred significant opportunity costs compared to investing in longer-term non-rated municipal bonds. Since then, market forecasters have continually predicted the Federal Reserve would soon shift policy direction and resume cutting rates. To their surprise, persistent inflation, mixed economic data, and broader macroeconomic concerns delayed the Fed from lowering their target rates until September 2024. Even then, after three rate cuts, the Fed paused any further action until their most recent meeting, when they announced a 25 bps cut this September. While the Fed’s policy shift may have been more delayed than many market participants expected, the new interest rate environment has dramatically reduced the yields on short-term fixed-income investments. While investors hiding out in these investments did fairly well (1-Year US Treasury Bills had an annualized total return of 4.73% from October 1, 2023 through October 1, 2025), they may have run out of time. They are now faced with a completely new opportunity cost calculus to consider. The yield on 1-Year US Treasury Bills on September 30, 2023, was 5.50%. Today, the yield is 3.60%. Meanwhile, yields on longer dated bonds have remained relatively stable. The 30-Year US Treasuries was yielding 4.70% on September 30, 2023, and now yields 4.73%. Longer dated non-rated municipal bonds carried a tax-exempt yield of 7.00% in September 2023 and have tightened very modestly, yielding 6.75% today. The “curve spread,” which measures the difference in yield between short- and long-term bonds, has increased significantly. As we mentioned in our “Looking Ahead” section of our January Note:
“One implication of a steeper yield curve is an increased “cost of complacency” of hiding out in short-term investment vehicles. The relative value of extending duration becomes more attractive and should continue to spur investor demand for higher yielding fixed income products (such as non-rated municipals).”
To help investors compare the new opportunity cost of short-term taxable instruments compared to non-rated tax-exempt bonds, we have updated our Cost of Complacency analysis. We have created two simple scenarios over a 5-year time horizon using current US T-Bill rates and generic 20-year non-rated municipal rates: a stable rate environment going forward and a modest 0.25% reduction in rates per year.

In a stable rate environment, investing in 12-month T-Bills generates a 2.07% after-tax total return... not nearly as attractive as it was two years ago. Investors are now sacrificing 4.69% per year (after-tax) compared to a 20-year non-rated tax-exempt bond yielding 6.75%. In a modestly declining rate environment, that opportunity cost grows to 6.76% per year (again, after-tax). Investors who have remained in cash alternatives would be wise to consider how these new opportunity costs affect their portfolios and their ability to achieve their long-term goals. The time for complacency may have already ended…
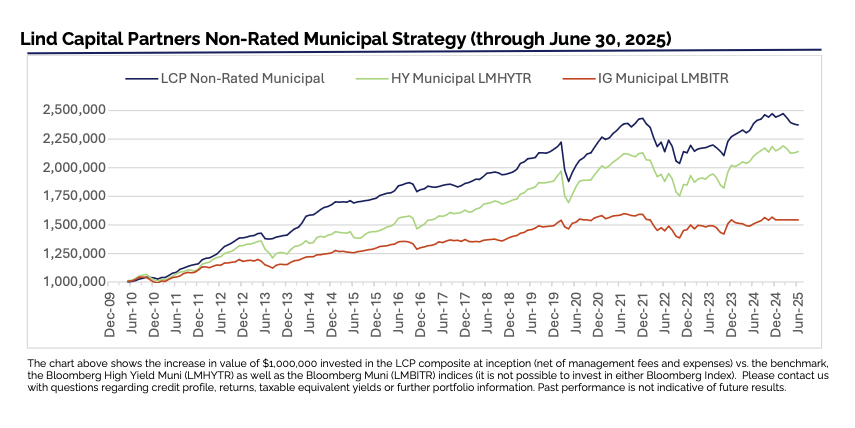
The chart above shows the increase in value of $1,000,000 invested in the LCP composite at inception (net of management fees and expenses) vs. the benchmark, the Bloomberg High Yield Muni (LMHYTR) as well as the Bloomberg Muni (LMBITR) indices (it is not possible to invest in either Bloomberg Index). Please contact us with questions regarding credit profile, returns, taxable equivalent yields or further portfolio information. Past performance is not indicative of future results.
Lind Capital Partners Municipal Market Charts