

| 11-01-26 | 10-01-26 | 11-01-25 | 11-01-23 | 11-01-21 | |
|---|---|---|---|---|---|
| 10-Year AAA BVAL Municipal | 3.40% | 4.22% | 2.69% | 3.62% | 1.21% |
| 10-Year US Treasury | 4.94% | 5.24% | 4.08% | 4.93% | 1.56% |
| 10-Year Muni vs. Treasury Ratio | 69% | 81% | 66% | 73% | 77% |
| IG Fund Flows* YTD | $40.7B | $32.7B | $12.3B | ($15.5B) | $72.9B |
| HY Fund Flows* YTD | $2.9B | $4.9B | $9.8B | ($1.4B) | $18.9B |
| IG (LMBITR) Total Return YTD | (0.71%) | (4.82%) | 4.05% | (2.22%) | 0.50% |
| HY (LMHYTR) Total Return YTD | 1.67% | (2.44%) | 2.55% | (1.60%) | 6.09% |
| New Issue Calendar YTD | $515B | $466B | $482B | $305B | $387B |
*Weekly reporting funds, only
Municipal Market Performance and Benchmark Rates: October proved to be an exceptional recovery month for municipal bonds, reversing much of September's losses following the market's worst monthly performance since 2008. Declining Treasury yields, easing interest rate pressures, and an equity-driven flight to quality provided a favorable backdrop. Improving municipal market technicals amplified the rally, allowing municipal bonds to significantly outperform US Treasuries.
US Treasury yields declined between 32 and 36 bps five years and longer. The AAA municipal benchmark curve bull-steepened, with yields falling 78 bps in five years, 71 bps in ten years, and 39 bps in thirty years. The comparatively modest decline in long-term municipal yields reflected persistent new-issue supply and continued outflows from open-end mutual funds.
October 2026 was the strongest October on record for both municipal bond indices by a substantial margin. The investment-grade Bloomberg Municipal Bond Index (LMBITR) returned 3.62% for the month, although its year-to-date return remained negative at (0.71%). The Bloomberg High Yield Municipal Bond Index (LMHYTR) slightly underperformed, returning 3.42% in October, but maintained a positive year-to-date return of 1.67%.
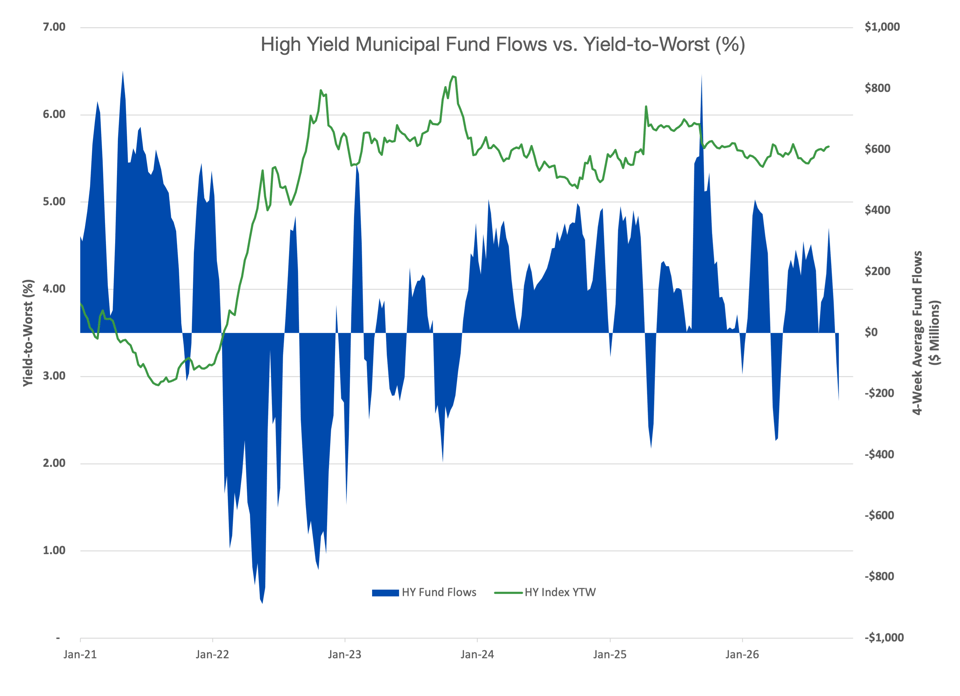
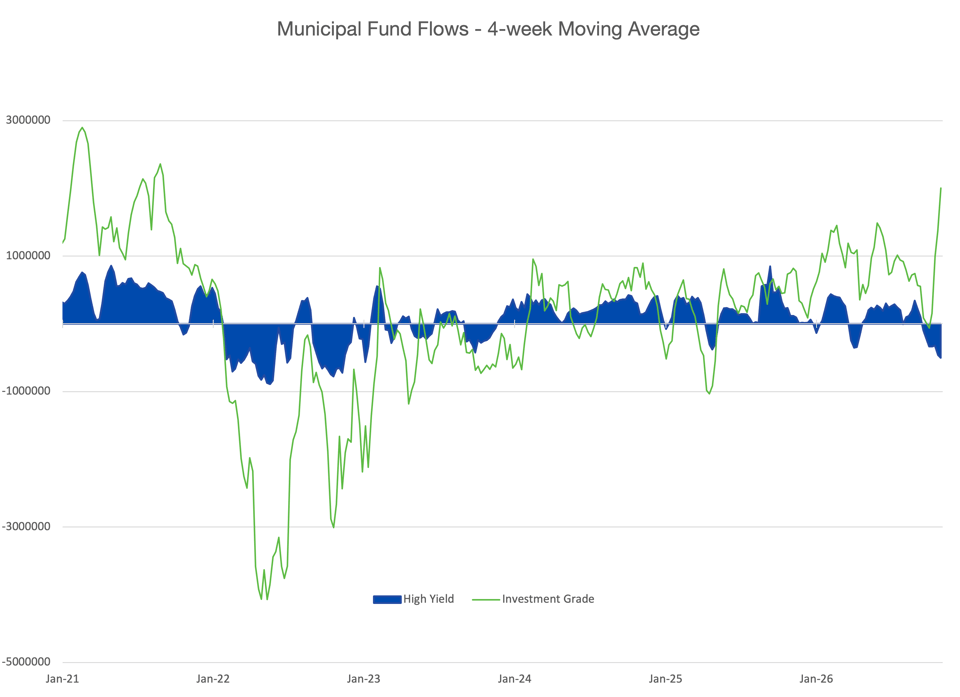
Mutual Fund Flows: October presented two contrasting trends in municipal fund flows. In aggregate, municipal investment vehicles recorded inflows exceeding $1 billion each week, totaling more than $6 billion for the month. High-yield funds, however, experienced outflows every week, totaling approximately $2 billion.
More importantly, the divergence between open-end mutual funds and exchange-traded funds (ETFs) continued to widen. Both investment-grade and high-yield open-end mutual funds experienced eight consecutive weeks of outflows, offset by inflows into investment-grade and high-yield ETFs during each of those weeks. As discussed below, this divergence reflects a broader shift in how investors access the municipal market, with important implications for market liquidity and trading dynamics.
Primary Market Supply: New-issue volume totaled approximately $57 billion in October, down 7% from the same period last year but 15% above the trailing five-year average. Year-to-date issuance exceeds $500 billion, slightly ahead of last year's record-setting pace.
While next week's primary calendar is expected to be relatively subdued ahead of the midterm elections, voters will consider more than $80 billion in proposed bond measures, potentially a recent record. If approved and subsequently issued, these bonds could contribute to continued supply pressures—and create additional investment opportunities—in the months and years ahead.
Lind Capital Partners Non-Rated Market Commentary
Liquidity: Changing the wrapper cannot change what is inside… As noted above, headline municipal fund flows were positive in October, but a closer examination reveals a significant change in their composition. This reflects a broader shift in how investors own municipal bonds. Traditionally, open-end mutual funds have been a principal vehicle for individual investors. Over the past several years, however, separately managed accounts (SMAs) and exchange-traded funds (ETFs) have become increasingly important alternatives.
According to the Municipal Securities Rulemaking Board (MSRB), ETFs held just 1.4% of outstanding municipal bonds in 2020, compared with 3.7% in 2025. Over the same period, traditional mutual fund ownership remained relatively stable, declining from 22% to 21%. Since January 2026, this trend has continued, with ETFs attracting $46 billion in net inflows while open-end mutual funds have experienced $2 billion in net outflows. These changes reflect a significant shift in how investors access the municipal bond market.
Despite changes in investor access, the underlying municipal bond market remains largely unchanged: more than 50,000 issuers, approximately 1.4 million individual CUSIPs, and a myriad of different structural and credit characteristics. The market remains highly fragmented, with many securities trading infrequently. Each of the four principal investment vehicles—open-end mutual funds, ETFs, interval funds, and SMAs—offers a different mechanism for investor liquidity, but none can make an inherently illiquid municipal bond liquid.
| Investment Vehicle | Investor Liquidity | Impact of Other Investor Redemptions |
|---|---|---|
| Open-End Mutual Funds | Daily at NAV | Fund may need to sell bonds to meet redemptions |
| ETF | Intraday at Market Price | Selling pressure may widen discounts to NAV |
| Interval Fund | Limited, periodic repurchases at NAV | Repurchases may require bond sales |
| SMA | Individual bond sales or maturities | No forced sales from other investors’ withdrawals |
During periods of market dislocation and heavy investor redemptions, open-end mutual funds may be forced to sell securities irrespective of their underlying credit characteristics. As we have often noted, forced selling can depress market prices, particularly when dealers are reluctant to commit capital. ETF investors may encounter widening bid-ask spreads and growing discounts to reported NAV as buyers demand compensation for providing liquidity. Although ETF shares generally trade between investors, redemptions involving underlying securities can transmit additional selling pressure into the municipal market. In March 2020, large investment-grade municipal ETFs traded at discounts approaching 6% to reported NAV. The dislocation was even more pronounced in the high-yield market, where the VanEck High Yield Municipal ETF (HYD) experienced a 28.3% divergence from its benchmark index during the market turmoil. While the latter figure represents a divergence from benchmark performance rather than a discount to NAV, both illustrate how dramatically the market price of an ETF can depart from reported valuations and benchmark performance during periods of severe market stress.
As we consistently highlight, liquidity-driven selling can create opportunities for investors and managers who are not required to liquidate holdings to meet daily redemptions. SMAs allow investors to hold bonds through market disruptions without being directly affected by other investors' withdrawal decisions. Interval funds limit repurchases to scheduled offers, providing managers greater flexibility to maintain longer-term positions. Both structures can allow portfolio managers to purchase securities at attractive prices when other investors are forced to sell, provided capital is available. Importantly, market price declines during periods of dislocation do not necessarily indicate deterioration in the underlying credit.
Lind Capital Partners has concentrated on non-rated municipal securities since our founding. Many of these securities trade infrequently because of their size, structure, or limited investor following—not necessarily because of weak credit fundamentals. Independent credit analysis, identifiable collateral protections, and ongoing credit surveillance remain central to our investment process. Both SMAs and interval funds complement this approach by allowing managers to pursue longer-term credit opportunities without the same daily redemption pressures faced by traditional open-end mutual funds.
The liquidity of an investment vehicle influences how quickly an investor can exit, but the liquidity of the underlying securities ultimately influences the price of that exit. Investors with a long-term investment horizon, patience, professional credit management, and an appropriate investment structure can exploit meaningful investment opportunities.
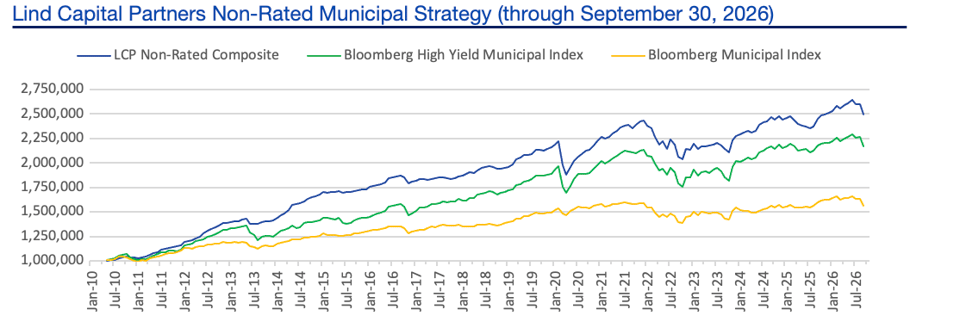
The chart above shows the increase in value of $1,000,000 invested in the LCP composite at inception (net of management fees and expenses) vs. the benchmark, the Bloomberg High Yield Muni (LMHYTR) as well as the Bloomberg Muni (LMBITR) indices (it is not possible to invest in either Bloomberg Index). Please contact us with questions regarding credit profile, returns, taxable equivalent yields or further portfolio information. Past performance is not indicative of future results.
Lind Capital Partners Municipal Market Charts
 Sources: Refinitiv and Bloomberg LP