
Lind Capital Partners Municipal Market Commentary
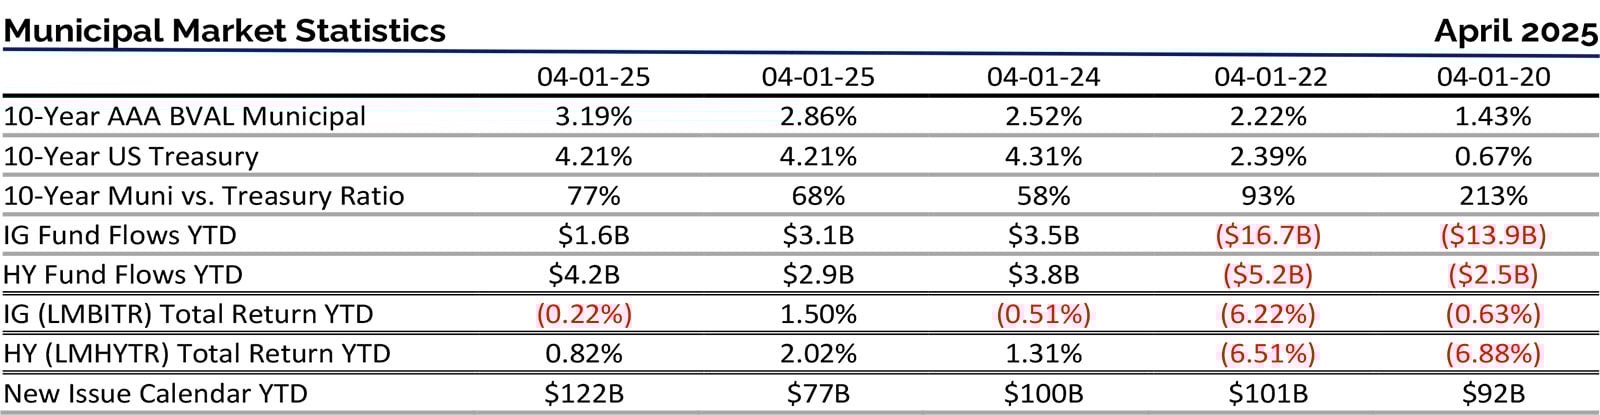
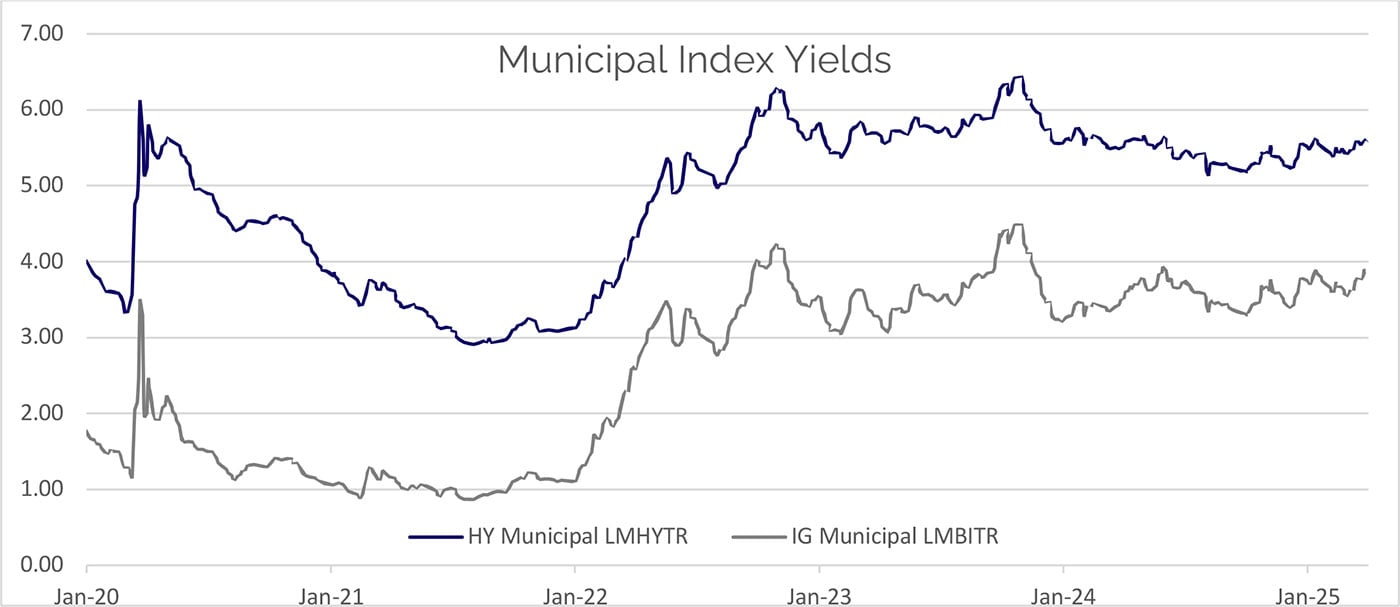
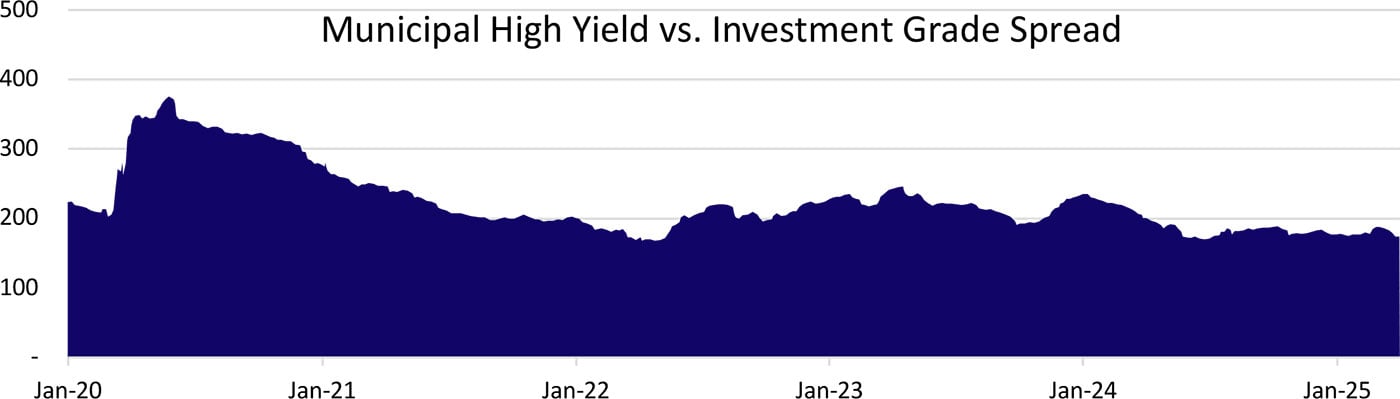
Municipal Market Performance and Benchmark Rates: Municipal market participants entered March cautiously, as this time of year historically presents some challenging hurdles for performance. Wariness was justified as municipal bonds posted the worst month—compared to their US Treasury counterpart—since March 2020. The Bloomberg Barclays Municipal Bond Index (LMBITR) lost just over (2%) this month whereas the US Treasury Index was roughly flat, losing only (0.05%). High-yield munis also underperformed the US Treasury market, posting a loss of (1.57%). The outperformance of HY munis vs IG munis persisted, however, making that 3 straight months and 12 out of the last 15 months dating back to the beginning of 2024.
Typical seasonal factors – elevated supply, lighter reinvestment flows, and tax-related selling—were exacerbated by the ongoing broader volatility caused by escalating tariff wars, clashing views on growth andinflation, and general uncertainty. As such, the AAA municipal benchmark rose by 22 bps in 5 years, 33 bpsin 10 years, and 35 bps in 30 years.
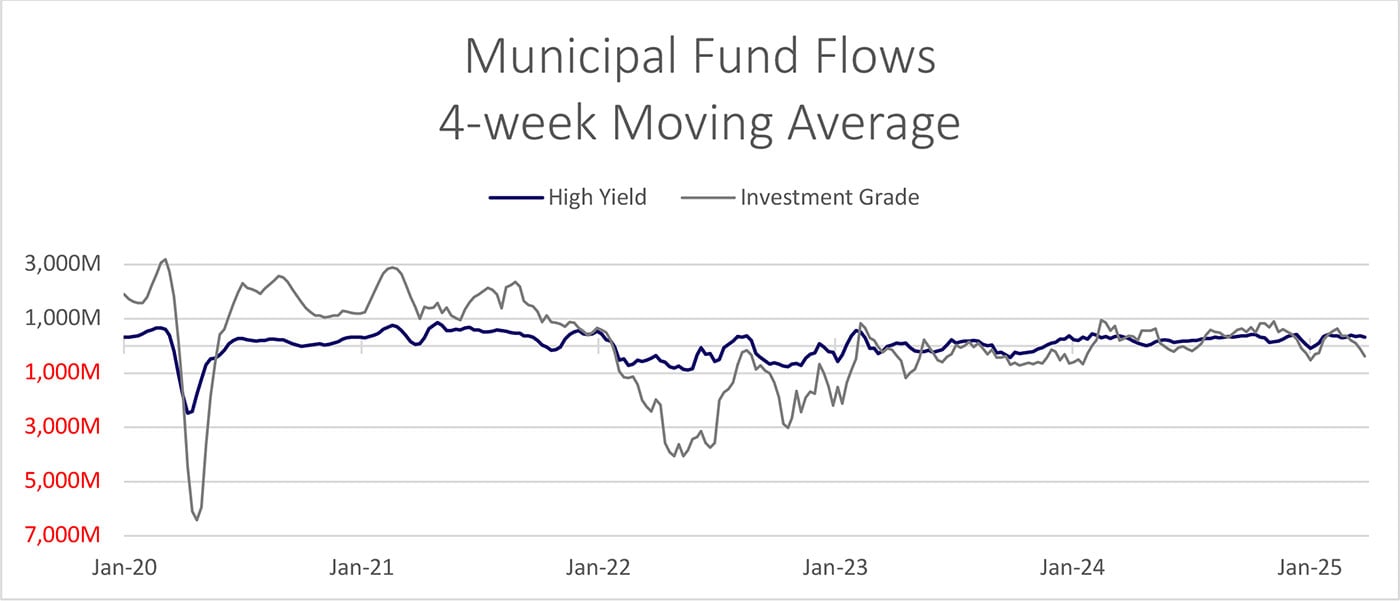
Mutual Fund Flows: The positive momentum exhibited by 7-straight weeks of inflows over the past few months came to a screeching halt in March as investment-grade mutual funds experienced 3-straight weeks of outflows to close out the month. With that said, the aggregate monthly outflow was not too severe, totaling $290M ($5.5B inflows YTD). High yield funds, on the other hand, which have not yet experienced a weekly outflow in 2025, experienced the second consecutive month of cumulative inflows totaling $1.25B ($4.4 Binflows YTD). As we’ve referenced previously, high yield funds have now garnered over 75% of total municipal fund flows, despite representing a fraction of the overall market, illustrating the compelling opportunity set presented by the asset class.
Primary Market Supply: An enduring theme in the market this year is the surge in new issue supply. March primary supply was up 20% vs 2024 and the trailing 5-year average for the month. Borrowers remain committed to financing critical infrastructure projects, despite interest rate volatility, especially as chatter surrounding any potential future tax changes gets louder. The high yield primary market remains healthy as deals viewed favorably by the buyer base are seeing significant levels of oversubscription whereas morespeculative deals are failing to get done.
In like a lion and out like a lion, beware the Ides of March. The month of March was unkind to municipal bond investors as the market became untethered from all other markets. As a result, municipals under-performed the US Treasury market significantly across the curve. As noted above, 10-year AAA municipal rates rose nearly 35 bps while 10-year UST yields were unchanged. Some might attribute the performance to a comment widely publicized in the municipal market by economist Stephen Moore (a fellow New Trier High School graduate) where he suggested eliminating tax-exemption for municipal bonds, potentially saving $250 billion over a decade. However, it is also estimated that borrowing costs for municipal projects would increase by $824 billion over the same time frame. Additionally, estimates of cost savings from the elimination of tax-exemption likely do not contemplate the impact of a dynamic investor base shifting from tax paying individuals to non-taxpaying investors, IRAs, 401Ks, pension funds, and life insurance companies. As we saw with the Build AmericaBond program interest rate subsidy, changes to the tax code result in significant changes in investor behavior.
Lind Capital Partners Municipal Non-Rated Market Commentary
More likely, the dramatic selloff in March should be attributed to technical factors unrelated to tax talk. As we noted in February and again in March, new issue supply has increased dramatically. February and March are low months for bond maturities, redemptions and coupon payments, limiting natural demand and fund flows have been negative for the last three weeks of the month. Heavy supply combined with negative fund flows will almost always result in market underperformance. With approximately 70% of outstanding municipal debt held by individual investors (bonds, mutual funds, ETFs, etc…) the municipal market is fundamentally driven by supply-demand dynamics.
We expect this trend to continue through April with elevated supply and muted demand. April is typically a month with negative fund flows as investors sell municipal holdings to pay their federal income tax bills.Supply should remain strong as borrowers lock-in capital commitments for summer building projects. Finally, we do not see the recent turmoil as the result of systematic credit concerns. We continue to view the current credit environment as the strongest, generally, since the onset of COVID 5+ years ago.
Today, we continue to populate new portfolios with tax-exempt yields between 6.50% and 7.00% in our 8 target revenue bond sectors. Interestingly, the outliers 7.00%+ yields that have been harder to find in 2025, given positive fund flows to high yield funds, seem to be coming available with greater frequency. As we have seen in the past, when investors get their April statements and realize how poorly the investment grade market has performed, year to date, we think there may be additional selling pressure.
Finally, all the talk surrounding tariffs, reciprocal and punitive, has had an impact on inflation fears and recession discussions. It is worth noting that we view the municipal market broadly and our target sectors specifically as largely recession resistant. Senior living communities, charter schools, student and multifamily housing do not normally experience wide performance variance due to economic cycles. As a result, portfolios are likely to benefit from a slowing economy in the form of price performance, particularly given our ability to populate portfolios with bonds trading at 10% discounts to par. The discount provides investors with a significant call protection in a falling rate environment.
Clearly, investors initiating in the municipal market today must be comfortable with the risk the House and Senate agree to eliminate or significantly change the tax-exempt status for the $4 trillion municipal bond market. Market dynamics have created an opportunity for which we think the long-term benefits outweigh that risk.
Lind Capital Partners Non-Rated Municipal Strategy
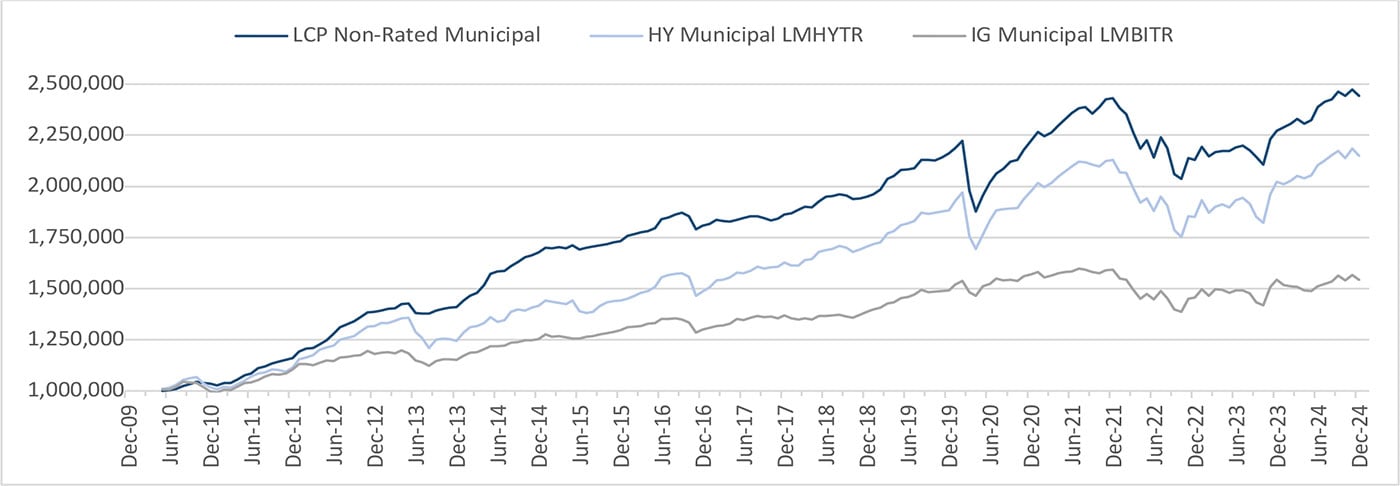
The chart above shows the increase in value of $1,000,000 invested in the LCP composite at inception (net of management fees and expenses) vs. the benchmark, the Bloomberg High Yield Muni (LMHYTR) as well as the Bloomberg Muni (LMBITR) indices (it is not possible to invest in either Bloomberg Index). Please contact us with questions regarding credit profile, returns, taxable equivalent yields or further portfolio information. Past performance is not indicative of future results.
Sources: Refinitiv and Bloomberg LP